
Overview
One of the key principles of writing a good data pipeline is ensuring accurate data is loaded into the target table. We have no control over the quality of the upstream data we read from, but we can have a few data quality (DQ) checks in our pipeline to ensure any bad data would be caught early on without letting it propagate downstream.
DQ checks are critical in making sure the data that gets processed every day is reliable, and that downstream tables can query them safely. This will save a lot of time and resources, as we will be able to halt the data flow, giving us some time to do RCA and fix the issue rather than pass incorrect data.
The biggest challenge with large data warehouses with multiple interdependent pipelines is that we would have no idea about the data issue if bad data gets introduced in one of the pipelines, and sometimes, it could take days, even before it’s detected. Even though DQ check failures could cause some temporary delay in landing the data, it’s much better than customers or users reporting data quality issues and then having to backfill all the impacted tables.
Some of the common data quality issues that could occur are:
- Duplicate rows – a table at user grain (which means there can only be one row per user), having duplicates
- 0 or null values – you expect certain critical columns not to have any null or 0 values, e.g., SSN, age, country columns
- Abnormal row count – the overall row count of the table suddenly increases or drops compared to the historical values
- Abnormal metric value – a specific metric, say ‘# of daily user logins’ suddenly spikes or drops compared to historical values
Note: The operators we will be referencing below are part of the Dataswarm and Presto tech stack, which are a proprietary data pipeline building tool and an SQL query engine, respectively, developed at Facebook.
Importance of Signal Tables
It’s a good practice to publish signal tables, which should serve as the source for downstream pipelines. These are essentially linked views that can be created on top of any table. Since they are views, they don’t take up any storage, so there is no reason not to build them. These should be created only after the DQ checks pass, and downstream pipelines should wait for these signal tables to be available rather than waiting for the source table directly, as these would have been vetted for any data anomalies.
Building the Right DAG
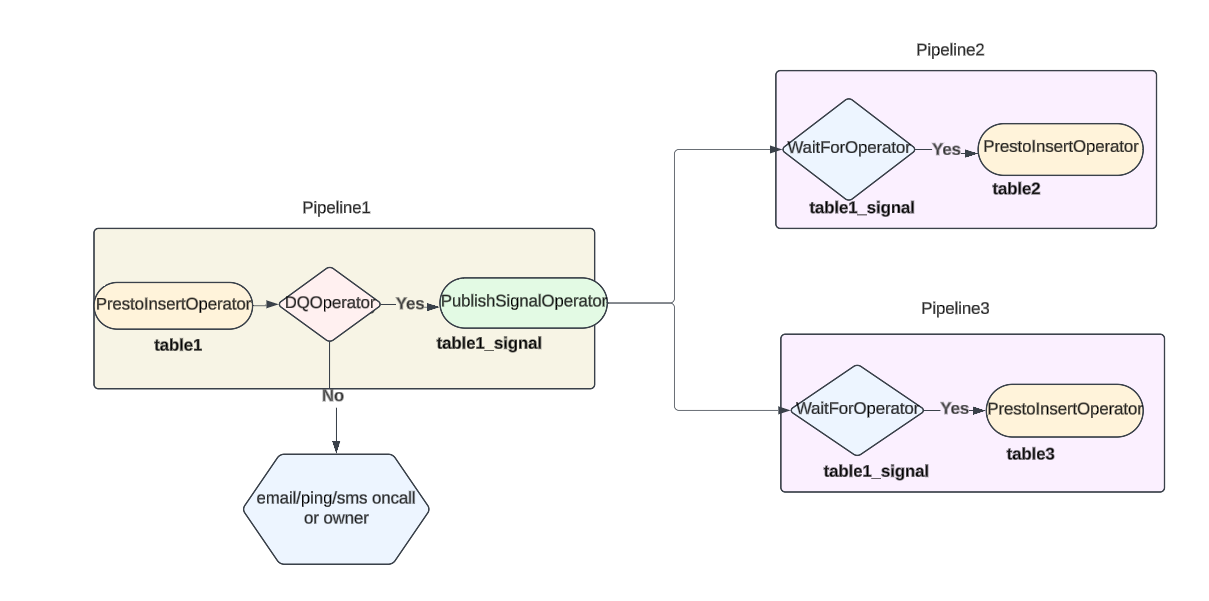
In the data lineage flow below, if bad data gets loaded into table1, then without DQ checks, they would get passed on to table2 and table3 as there is no way for pipelines2 and 3 to know of any data issues, as all they do is simply check if the table1 data has landed. But if DQ checks had been implemented, then it would fail the job/pipeline, and the table1_sigal wouldn’t have been created; thus, the downstream WaitForOperators would still be waiting, stopping the propagation of bad data.

Types of DQ Failures to Enforce
- Hard failure. If these DQ checks fail, the job will fail and notify the oncall or table owner, so the signal table will not be created. These could potentially cause downstream pipelines to be delayed and could be an issue if they have tighter Service Level Agreements (SLAs). But for critical pipelines, this might be worth it, as sending bad data could have catastrophic ripple effects.
- Soft failure. If these fail, the oncall and table owner would be notified, but the job won’t fail, so the signal table would still get published, and the data would get loaded and propagated downstream. For cases where the data quality loss is tolerable, this can be used.
Setting Up DQ Checks
We will go over some examples of how we can set up the different DQ checks and some simplified trigger logic behind each of the DQ operators.
Some things to know beforehand:
'<DATEID>'is a macro that will resolve to the date the Dataswarm pipeline is scheduled to run (e.g., when the job runs on Oct 1, 2020, it will resolve tods="2020-10-01").- The output of
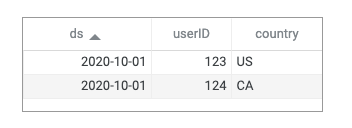
presto_apiwill be an array of dictionaries, e.g.,[{'ds': '2020-10-01', 'userID': 123, ‘country’: ‘US’}, {'ds': '2020-10-01', 'userID': 124, ‘country’: ‘CA’}, {...}], where each dictionary value represents the corresponding row values of the table being queried, and the key is the column name. Below would be the table representation of the data,
Duplicate Rows
We can simply aggregate by the key column (e.g., userID) specified by the user and check if there are any duplicate rows present by peforming a simple GROUP BY with a HAVING clause, and limiting to just 1 row. The presto_results variable should be empty ([]); if not, then there are duplicates present in the table.
LIMIT 1
”’
)
if len(presto_results) > 0:
# NOTIFY oncall/owner
# JOB KILLED
else:
# JOB SUCCESS” data-lang=”text/x-python”>
# output will be an array of dict representing reach row in the table
# eg [{'ds': '2020-10-01', 'userID': 123}, {...}]
presto_results = presto_api(
   namespace="namespace_name",
   sql=""'
   SELECT
       useriID
   FROM table
   WHERE
	ds="<DATEID>"
   GROUP BY 1
   HAVING
       SUM(1) > 1
   LIMIT 1
   '''
)
if len(presto_results) > 0:
   # NOTIFY oncall/owner
   # JOB KILLED
else:
   # JOB SUCCESS
0 or Null Values
We can check if any of the specified columns have any invalid values by leveraging count_if presto UDF. Here, the output, if there are no invalid values, should be [{'userid_null_count': 0}].
# NOTIFY oncall/owner
# JOB KILLED
else:
# JOB SUCCESS” data-lang=”text/x-python”>
presto_results = presto_api(
   namespace="namespace_name",
   sql=""'
   SELECT
       COUNT_IF(
           userid IS NULL OR userid = 0
       ) AS userid_null_count
   FROM table
   WHERE
       ds="<DATEID>"
   '''
)

if presto_results[0]['userid_null_count'] > 0:
   # NOTIFY oncall/owner
   # JOB KILLED
else:
   # JOB SUCCESS
Abnormal Row Count
To get a sense of what the normal/expected row count is for a table on a daily basis, we can do a simple 7-day average of the previous 7 days, and if today’s value deviates too much from that, we can trigger the alert. The thresholds can be either:
- Static – a fixed upper and lower threshold that is always static. Every day, the operator checks if today’s row count is either over or below the thresholds.
- Dynamic – use a +x% and -x% threshold value (you can start with, say, 15%, and adjust as needed), and if today’s value is greater than the 7d avg + x% or lower than the 7d avg – x%, then trigger the alert.
“””,
)
dq_row_check_result = presto_api(
namespace=”namespace_name”,
sql=””‘
SELECT
ds,
row_count
FROM dq_check_output_table
WHERE
ds >= ‘
ORDER BY 1
”’
)
# we will loop through the dq_row_check_result object, which will have 8 values
# where we will find the average between DATEID-7 and DATEID-1 and compare against DATEID
x = .15 # threshold
prev_7d_list = dq_row_check_result[0:7]
prev_7d_sum = sum([prev_data[‘row_count’] for prev_data in prev_7d_list])
prev_7d_avg = prev_7d_sum/7
today_value = dq_row_check_result[-1][‘row_count’]
upper_threshold = prev_7d_avg * (1 + x)
lower_threshold = prev_7d_avg * (1 – x)
if today_value > upper_threshold or today_value < lower_threshold:
# NOTIFY oncall/owner
# JOB KILLED
else:
# JOB SUCCESS” data-lang=”text/x-python”>
dq_insert_operator = PrestoInsertOperator(
   input_data = {"in": "source_table"},
   output_data = {"out": "dq_check_output_table"},
   select = """
   SELECT
       SUM(1) AS row_count
   FROM source_table
   WHERE
       ds="<DATEID>"
   """,
)

dq_row_check_result = presto_api(
   namespace="namespace_name",
   sql=""'
   SELECT
       ds,
       row_count
   FROM dq_check_output_table
   WHERE
       ds >= '<DATEID-7>'
   ORDER BY 1
   '''
)

# we will loop through the dq_row_check_result object, which will have 8 values
# where we will find the average between DATEID-7 and DATEID-1 and compare against DATEID
x = .15 # threshold
prev_7d_list = dq_row_check_result[0:7]
prev_7d_sum = sum([prev_data['row_count'] for prev_data in prev_7d_list])
prev_7d_avg = prev_7d_sum/7
today_value = dq_row_check_result[-1]['row_count']
upper_threshold = prev_7d_avg * (1 + x)
lower_threshold = prev_7d_avg * (1 - x)

if today_value > upper_threshold or today_value < lower_threshold:
   # NOTIFY oncall/owner
   # JOB KILLED
else:
   # JOB SUCCESS
So, every day, we calculate the sum of the total row count and load it into a dq_check_output_table (a temporary intermediate table that is specially used for storing DQ aggregated results). Then, we query the last 7 days and today’s data from that table and store the values in an object, which we then loop through to calculate the upper and lower thresholds and check if today’s value is violating either of them.
Abnormal Metric Value
If there are specific metrics that you want to track to see if there are any anomalies, you can set them up similarly to the above ‘abnormal row count’ check.
“””,
)
dq_row_check_result = presto_api(
namespace=”namespace_name”,
sql=””‘
SELECT
ds,
distinct_user_count,
total_cost,
total_logins
FROM table
WHERE
ds >= ‘
ORDER BY 1
”’
)
” data-lang=”text/x-python”>
dq_insert_operator = PrestoInsertOperator(
   input_data={"in": "source_table"},
   output_data={"out": "dq_check_output_table"},
   select="""
   SELECT
       APPROX_DISTINCT(userid) AS distinct_user_count,
       SUM(cost) AS total_cost,
       COUNT_IF(has_login = True) AS total_logins
   FROM source_table
   WHERE
       ds="<DATEID>"
   """,
)

dq_row_check_result = presto_api(
   namespace="namespace_name",
   sql=""'
   SELECT
       ds,
       distinct_user_count,
       total_cost,
       total_logins
   FROM table
   WHERE
       ds >= '<DATEID-7>'
   ORDER BY 1
   '''
)
Here, we calculate the distinct_user_count, total_cost, and total_logins metric and load it into a dq_check_output_table table, which we will query to find the anomalies.
Takeaways
- You can extend this to any kind of custom checks/alerts like month-over-month value changes, year-over-year changes, etc. You can also specify
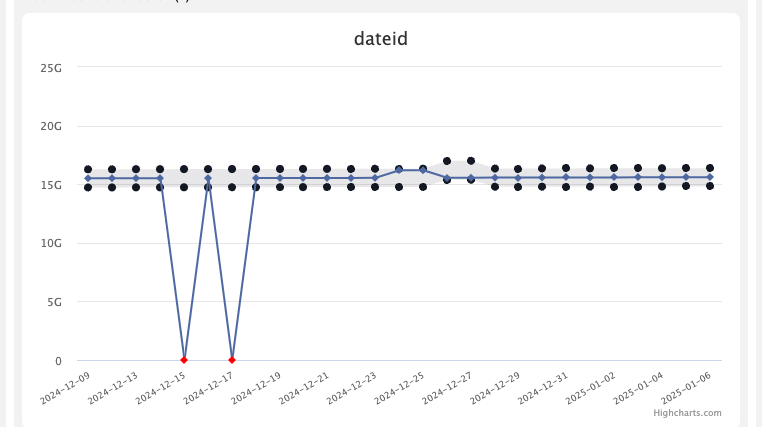
GROUP BYclauses, for example, track the metric value at the interface or country level over a period of time. - You can set up a DQ check tracking dashboard, especially for important metrics, to see how they have been behaving over time. In the screenshot below, you can see that there have been DQ failures for two of the dates in the past, while for other days, it has been within the predefined range. This can also be used to get a sense of how stable the upstream data quality is.
- They can save a lot of time as developers would be able to catch issues early on and also figure out where in the lineage the issue is occurring.
- Sometimes, the alerts could be false positive (FP) (alerts generated not due to bad/incorrect data, but maybe due to seasonality/new product launch, there could be a genuine volume increase or decrease). We need to ensure such edge cases are handled correctly to avoid noisy alerts. There is nothing worse than oncall being bombarded with FP alerts, so we want to be mindful of the thresholds we set and tune them as needed periodically.


