
JFrog and New Relic jointly announced today they will provide a free integration tool that will enable New Relic’s observability platform to consume log data from JFrog platforms for building and deploying applications securely.
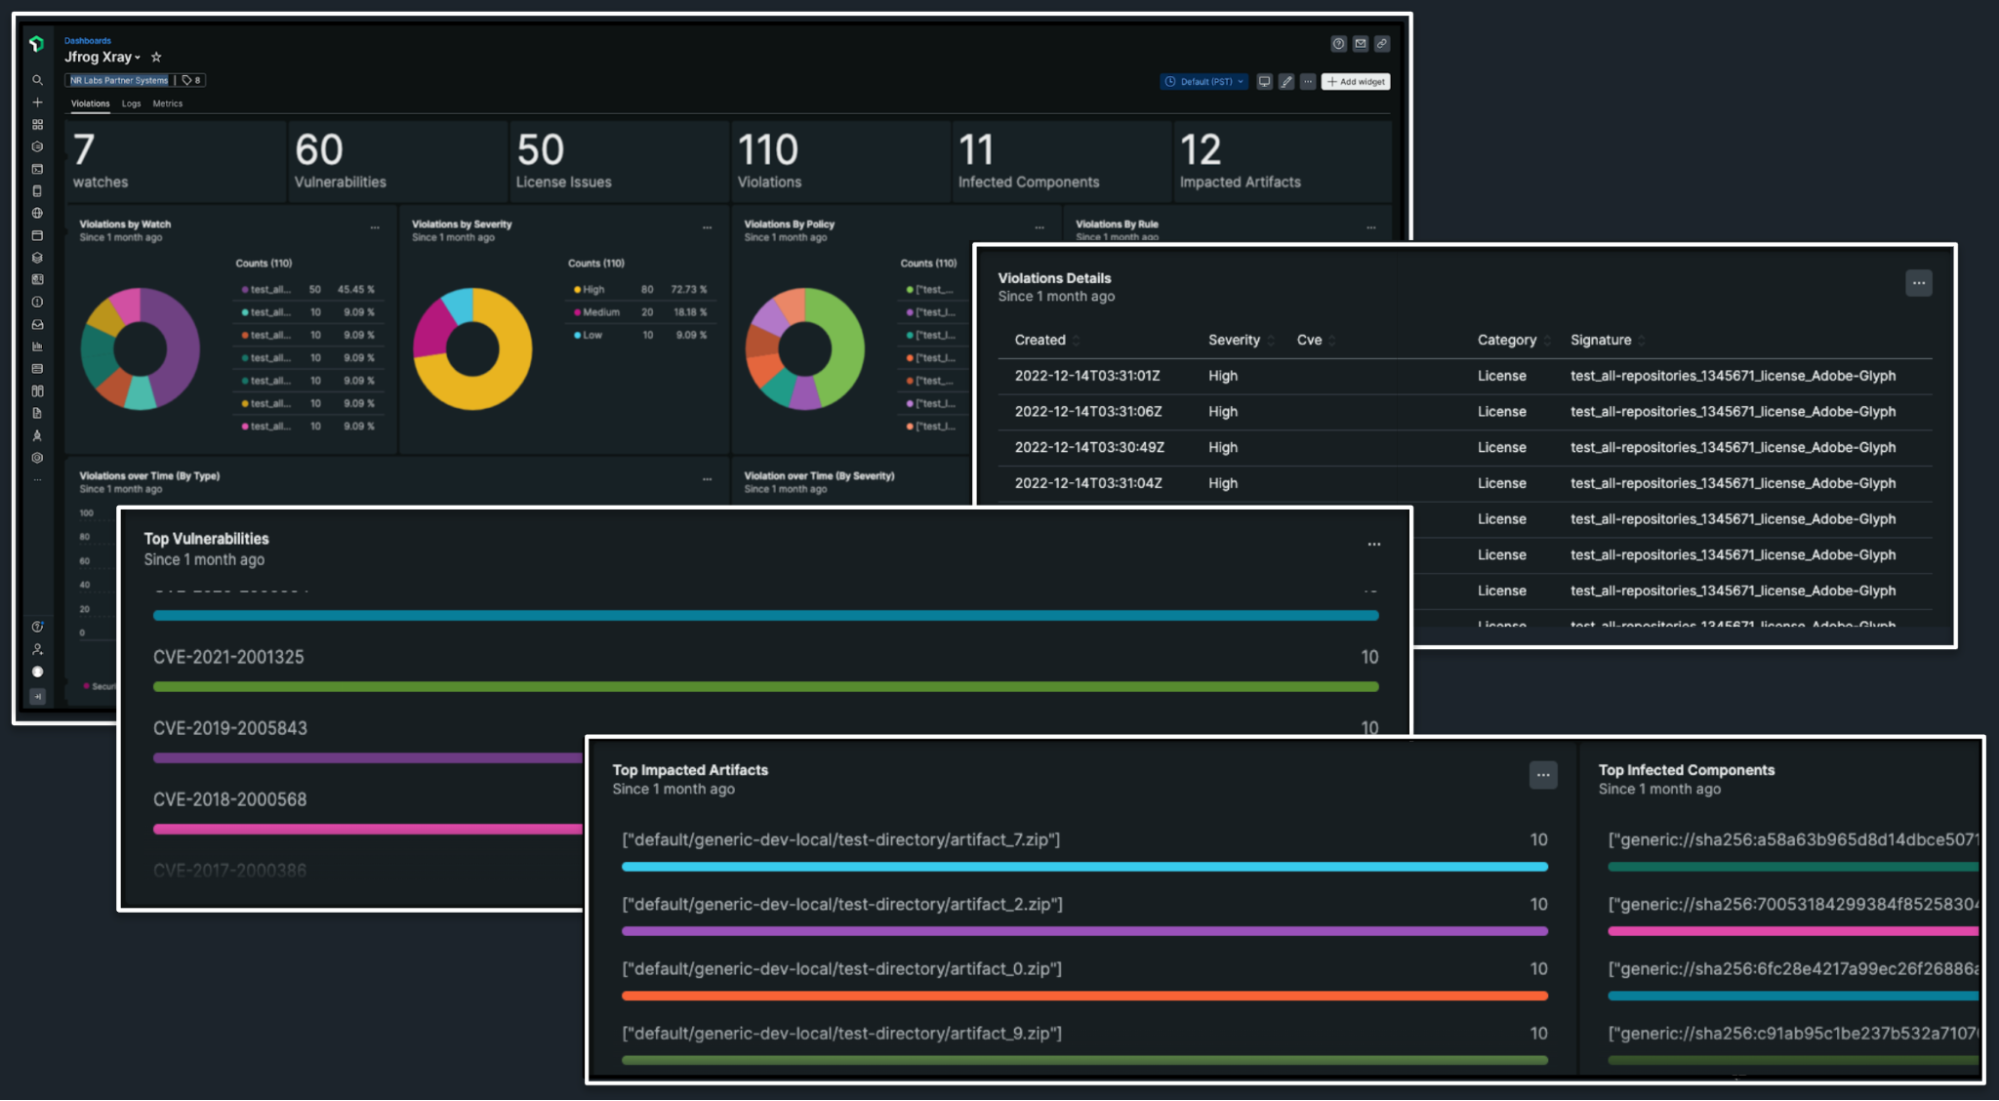
Announced at the Futurestack conference hosted by New Relic, this integration eliminates the manual effort that was previously required to integrate these platforms. Preconfigured New Relic dashboards provide a comprehensive view of performance data, artifact usage and security metrics in real-time that is automatically collected from JFrog Artifactory and JFrog Xray environments and then displayed alongside other telemetry data.
Omer Cohen, executive vice president of strategy at JFrog, said that capability will make it easier to identify performance issues, urgent vulnerabilities and malicious users in a way that reduces the amount of time required to remediate those issues across the software supply chain.

The goal now is to eventually provide similar levels of integration between JFrog platforms that enable DevOps teams to manage and secure application binaries with other observability platforms, added Cohen.
It’s still early days as far as the adoption of observability platforms is concerned, but it’s apparent that as application environments become more complex the plethora of monitoring tools that DevOps teams rely on need to be augmented. Observability platforms promise to unify logs, metrics and traces in a way that makes it simpler to launch queries to identify the root cause of an issue. The rate at which DevOps teams will embrace observability will naturally vary, but the biggest obstacle might not be the platforms themselves. The biggest challenge is understanding which queries to actually launch to identify an issue that might later cause a major disruption. In the longer term, it’s expected that machine learning algorithms will leverage the data collected by observability platforms to automatically identify those issues. In the meantime, much still depends on the acumen of the DevOps team employing an observability platform.
In fact, a recent New Relic survey found only 27% of respondents have achieved full-stack observability, with only 5% claiming they have a mature observability practice in place. A third (33%) of respondents also said they still primarily detect outages manually or based on complaints, the survey found. More than half (52%) of respondents also admitted they experienced high-business-impact outages once per week or more and 29% said they take more than an hour to resolve those outages.
On the plus side, nearly three-quarters (72%) expected to maintain or increase their observability budgets next year. More than half (52%) of respondents, including 57% of C-suite executives, expected observability budgets to increase over the next year. A total of 14% of all respondents and 16% of IT decision-makers expected to increase observability budgets significantly or extensively. More than a third (36%) believe observability increases their productivity and enables them to find and resolve issues faster. Just under a third (32%) said observability enables cross-team collaboration, while more than a quarter said observability improves their ability to innovate.
One way or another, visibility into DevOps environments clearly needs to improve as application environments become more complex. The challenge, as always, is determining the cost required to achieve it.


