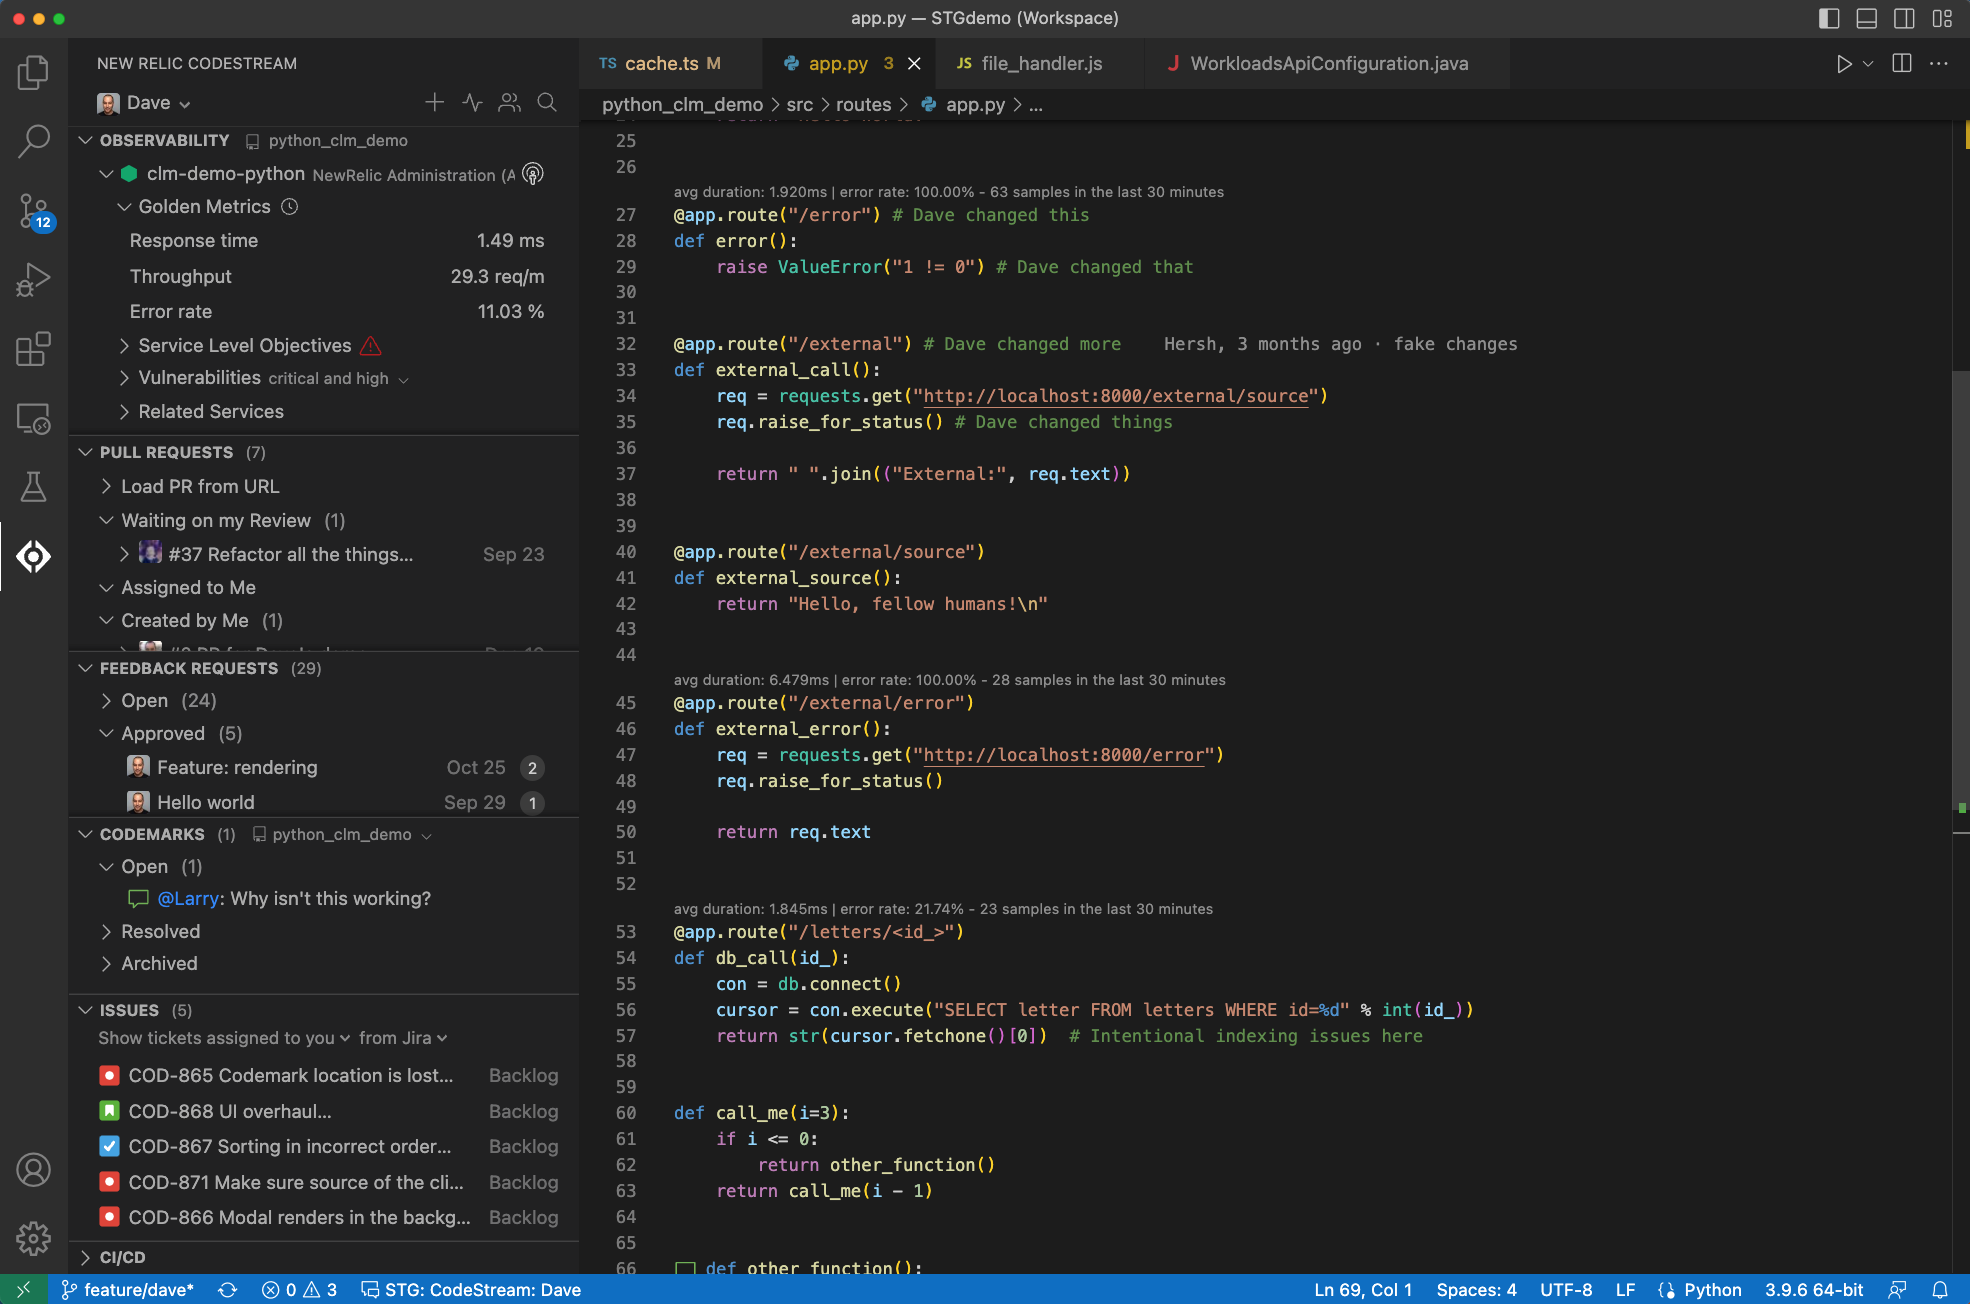
New Relic today added a free CodeStream module to its observability platform to give developers access to metrics and telemetry data that will enable them to write higher-quality code faster.
Peter Pezaris, group vice president and general manager of strategy and experience for New Relic, said this capability is part of an effort to shift observability left toward developers to optimize code as it is written and after it is deployed.
CodeStream surfaces metrics and telemetry data within the integrated development environment (IDE) developers use to write software. Telemetry metrics are displayed as a line of text above the code or in the debugging tool used to troubleshoot an application. Alternatively, developers can view metrics via an observability panel at the service level. They can also view performance metrics such as error rates and response times for related services.

That approach eliminates the need to wait for IT operations teams to surface issues that usually don’t manifest until long after the code in question was originally developed, noted Pezaris.
The overall goal is to provide development teams with frictionless access to observability data at every stage of the software development life cycle, he added. That analysis capability will result in faster mean-time-to-detection (MTTD), mean-time-to-resolution (MTTR) and, ultimately, shorter development cycles, said Pezaris.
Organizations should also be able to reduce technical debt faster by making it easier to identify issues that, for example, adversely impact application performance, he noted. That activity can be especially challenging because developers often inherit code written by someone else that often lacks clear documentation. CodeStream makes it simpler to onboard a developer to any application modernization initiative that has been launched to reduce technical debt, said Pezaris.
A recent New Relic survey found only 27% of respondents have achieved full-stack observability, and only 5% claimed they have a mature observability practice in place. A third (33%) of respondents also said they still primarily detect outages manually or based on complaints, the survey found.
On the plus side, the survey also found nearly three-quarters of respondents said C-suite executives in their organization are advocates of observability, and more than three-quarters of respondents (78%) saw observability as a key enabler for achieving core business goals. However, more than half (52%) of respondents said they experienced high-business-impact outages once per week or more, and 29% said they take more than an hour to resolve those outages.
A full 82% of respondents said they use four or more tools to monitor the health of their systems. Only 7% said their telemetry data is entirely unified and only 13% said the visualization or dashboarding of that data is entirely unified. Nearly half of the respondents (47%) said they would prefer to have a single, consolidated observability platform, but only 2% said they currently used one tool for observability.
Regardless of the approach to observability, it is clear that development and IT operations teams need to be looking at the same metrics and telemetry data at the same time to collaborate effectively.


