
One of the biggest challenges that developers and researchers face is deploying models for AI inference at scale. Traditionally, this involves relying on cloud services or complex server setups that can be expensive and resource intensive. However, with innovations like the vLLM AI Inference engine, Do-It-Yourself (DIY) model hosting is becoming more accessible and efficient. One can build cost-effective model-serving solutions for their machine learning needs.
vLLM
vLLM is an AI inference engine designed to efficiently serve large language models (LLMs) at scale. It is a robust, high-performance engine that provides a streamlined approach to serving AI models. It stands out in its ability to optimize resources and maintain low latency and high throughput even with large-scale models. The vLLM engine allows for faster inference times, improved memory management, and optimized execution, all of which are crucial for hosting models effectively on a DIY setup.
DIY Model Hosting
DIY model hosting provides several advantages, mainly:
- Cost savings. By setting up one’s own infrastructure, one can eliminate the recurring costs of cloud service subscriptions. It gives the flexibility to scale the system as needed and only pay for the hardware in use.
- Data privacy and security. For sensitive applications, hosting models in-house ensures that private data doesn’t need to leave the premises. This can be a major selling point for organizations handling private or proprietary information.
- Control and customization. Self-hosting models allow complete control over the environment in which the models run. This includes custom configurations for optimal performance and integration with existing systems.
Benefits of DIY Model Hosting With vLLM
- Low latency and high throughput. One of the most compelling reasons to choose vLLM is its ability to provide low latency and high throughput, even for large models. In the context of AI and machine learning, latency refers to the time it takes for an AI model to process input and return a result. High throughput refers to the number of queries or operations that can be processed in a given time frame.
- Scalability. A key aspect of AI hosting is ensuring that the infrastructure can scale according to demand. vLLM provides scalability, allowing scale up or down based on traffic. Whether running a single small model or running several large language models, vLLM can efficiently distribute the load across multiple machines, ensuring consistent performance.
Getting Started With vLLM
vLLM is open source, and installation is relatively simple. The below sections cover installing and running it on Ubuntu without any GPU. Other detailed installation guides are available on vLLM’s GitHub repository. Once the model is up and running, settings can be tweaked to optimize performance and scale based on demand. vLLM allows tracking performance, adjusting resources, and updating models as needed.
Prerequisites
- Ubuntu (No GPU needed) and Docker
- Set up Conda
Steps
1. Set up a Conda virtual environment.
conda create -n vllm python=3.12 -y
conda activate vllm
2. Clone the vLLM repository.
git clone https://github.com/vllm-project/vllm.git
cd vllm
3. Build and run a vLLM server for CPU.
docker build -f Dockerfile.cpu -t vllm-cpu-env --shm-size=4g .
docker run --rm -it --network=host vllm-cpu-env --model Qwen/Qwen2.5-1.5B-Instruct

...
INFO 02-17 06:10:39 api_server.py:937] Starting vLLM API server on http://0.0.0.0:8000
...
INFO:     Started server process [1]
INFO:     Waiting for application startup.
INFO:     Application startup complete.
4. Run a simple curl request against the vLLM server and check the response:
Input: “What is your name?”
Output: “I am a computer program, so I don’t have a physical name. Is there anything specific you would like to know or discuss? I’m here to help with any questions you might have! How can I assist you today?”
curl http://localhost:8000/v1/completions \
    -H "Content-Type: application/json" \
    -d '{
        "model": "Qwen/Qwen2.5-1.5B-Instruct",
        "prompt": "What is your name ?",
        "max_tokens": 50,
        "temperature":0
    }'

{
    "id": "cmpl-d04ccc0a035c4e27a263b42217524299",
    "object": "text_completion",
    "created": 1739774404,
    "model": "Qwen/Qwen2.5-1.5B-Instruct",
    "choices": [
        {
            "index": 0,
            "text": " I am a computer program, so I don't have a physical name. Is there anything specific you would like to know or discuss? I'm here to help with any questions you might have! How can I assist you today?",
            "logprobs": null,
            "finish_reason": "stop",
            "stop_reason": 151643,
            "prompt_logprobs": null
        }
    ],
    "usage": {
        "prompt_tokens": 5,
        "total_tokens": 52,
        "completion_tokens": 47,
        "prompt_tokens_details": null
    }
}
5. Server-side logs for this request give a lot of information around throughput, cache usage, etc.
INFO 02-17 06:40:04 logger.py:39] Received request cmpl-d04ccc0a035c4e27a263b42217524299-0: prompt: 'What is your name ?', params: SamplingParams(n=1, presence_penalty=0.0, frequency_penalty=0.0, repetition_penalty=1.0, temperature=0.0, top_p=1.0, top_k=-1, min_p=0.0, seed=None, stop=[], stop_token_ids=[], bad_words=[], include_stop_str_in_output=False, ignore_eos=False, max_tokens=50, min_tokens=0, logprobs=None, prompt_logprobs=None, skip_special_tokens=True, spaces_between_special_tokens=True, truncate_prompt_tokens=None, guided_decoding=None), prompt_token_ids: [3838, 374, 697, 829, 937], lora_request: None, prompt_adapter_request: None.
INFO 02-17 06:40:04 engine.py:275] Added request cmpl-d04ccc0a035c4e27a263b42217524299-0.
INFO 02-17 06:40:04 metrics.py:455] Avg prompt throughput: 0.7 tokens/s, Avg generation throughput: 0.1 tokens/s, Running: 1 reqs, Swapped: 0 reqs, Pending: 0 reqs, GPU KV cache usage: 0.0%, CPU KV cache usage: 0.0%.
6. More important metrics are available by looking into http://localhost:8000/metrics. The server produces the below metrics, which can be used for performance optimization. My previous article also covers more information about inference time compute.
|
Metric |
Description |
|---|---|
|
time_to_first_token_seconds |
The time it takes for the first output token to be produced |
|
time_per_output_token_seconds |
The time it takes for each output token to be produced |
|
e2e_request_latency_seconds |
The overall time taken for a request |
|
request_queue_time_seconds |
The time a request waits in the queue |
|
request_inference_time_seconds |
The time it takes for inference |
|
cache_config_info |
Cache configuration information |
|
num_requests_running |
Total count of requests that are running |
|
num_requests_waiting |
Total count of requests that are waiting |
|
gpu_cache_usage_perc |
GPU cache memory consumption |
|
cpu_cache_usage_perc |
CPU cache memory consumption |
|
cpu_prefix_cache_hit_rate |
Hit rate of CPU prefix cache |
|
gpu_prefix_cache_hit_rate |
Hit rate of GPU prefix cache |
|
request_success_total |
Total count of successful requests |
# HELP vllm:time_to_first_token_seconds Histogram of time to first token in seconds.
# TYPE vllm:time_to_first_token_seconds histogram
vllm:time_to_first_token_seconds_sum{model_name="Qwen/Qwen2.5-1.5B-Instruct"} 0.5297608375549316
vllm:time_to_first_token_seconds_count{model_name="Qwen/Qwen2.5-1.5B-Instruct"} 5.0
# HELP vllm:time_per_output_token_seconds Histogram of time per output token in seconds.
# TYPE vllm:time_per_output_token_seconds histogram
vllm:time_per_output_token_seconds_sum{model_name="Qwen/Qwen2.5-1.5B-Instruct"} 8.178969383239746
vllm:time_per_output_token_seconds_count{model_name="Qwen/Qwen2.5-1.5B-Instruct"} 196.0
# HELP vllm:e2e_request_latency_seconds Histogram of end to end request latency in seconds.
# TYPE vllm:e2e_request_latency_seconds histogram
vllm:e2e_request_latency_seconds_sum{model_name="Qwen/Qwen2.5-1.5B-Instruct"} 8.710693597793579
vllm:e2e_request_latency_seconds_count{model_name="Qwen/Qwen2.5-1.5B-Instruct"} 5.0
# HELP vllm:request_queue_time_seconds Histogram of time spent in WAITING phase for request.
# TYPE vllm:request_queue_time_seconds histogram
vllm:request_queue_time_seconds_sum{model_name="Qwen/Qwen2.5-1.5B-Instruct"} 0.005610227584838867
vllm:request_queue_time_seconds_count{model_name="Qwen/Qwen2.5-1.5B-Instruct"} 5.0
# HELP vllm:request_inference_time_seconds Histogram of time spent in RUNNING phase for request.
# TYPE vllm:request_inference_time_seconds histogram
vllm:request_inference_time_seconds_sum{model_name="Qwen/Qwen2.5-1.5B-Instruct"} 8.70508337020874
vllm:request_inference_time_seconds_count{model_name="Qwen/Qwen2.5-1.5B-Instruct"} 5.0
# HELP vllm:cache_config_info Information of the LLMEngine CacheConfig
# TYPE vllm:cache_config_info gauge
vllm:cache_config_info{block_size="16",cache_dtype="auto",calculate_kv_scales="False",cpu_kvcache_space_bytes="4294967296",cpu_offload_gb="0",enable_prefix_caching="False",gpu_memory_utilization="0.9",is_attention_free="False",num_cpu_blocks="0",num_gpu_blocks="9362",num_gpu_blocks_override="None",sliding_window="None",swap_space_bytes="4294967296"} 1.0
# HELP vllm:num_requests_running Number of requests currently running on GPU.
# TYPE vllm:num_requests_running gauge
vllm:num_requests_running{model_name="Qwen/Qwen2.5-1.5B-Instruct"} 0.0
# HELP vllm:num_requests_waiting Number of requests waiting to be processed.
# TYPE vllm:num_requests_waiting gauge
vllm:num_requests_waiting{model_name="Qwen/Qwen2.5-1.5B-Instruct"} 0.0
# HELP vllm:gpu_cache_usage_perc GPU KV-cache usage. 1 means 100 percent usage.
# TYPE vllm:gpu_cache_usage_perc gauge
vllm:gpu_cache_usage_perc{model_name="Qwen/Qwen2.5-1.5B-Instruct"} 0.0
# HELP vllm:cpu_cache_usage_perc CPU KV-cache usage. 1 means 100 percent usage.
# TYPE vllm:cpu_cache_usage_perc gauge
vllm:cpu_cache_usage_perc{model_name="Qwen/Qwen2.5-1.5B-Instruct"} 0.0
# HELP vllm:cpu_prefix_cache_hit_rate CPU prefix cache block hit rate.
# TYPE vllm:cpu_prefix_cache_hit_rate gauge
vllm:cpu_prefix_cache_hit_rate{model_name="Qwen/Qwen2.5-1.5B-Instruct"} -1.0
# HELP vllm:gpu_prefix_cache_hit_rate GPU prefix cache block hit rate.
# TYPE vllm:gpu_prefix_cache_hit_rate gauge
vllm:gpu_prefix_cache_hit_rate{model_name="Qwen/Qwen2.5-1.5B-Instruct"} -1.0
# HELP vllm:request_success_total Count of successfully processed requests.
# TYPE vllm:request_success_total counter
vllm:request_success_total{finished_reason="length",model_name="Qwen/Qwen2.5-1.5B-Instruct"} 2.0
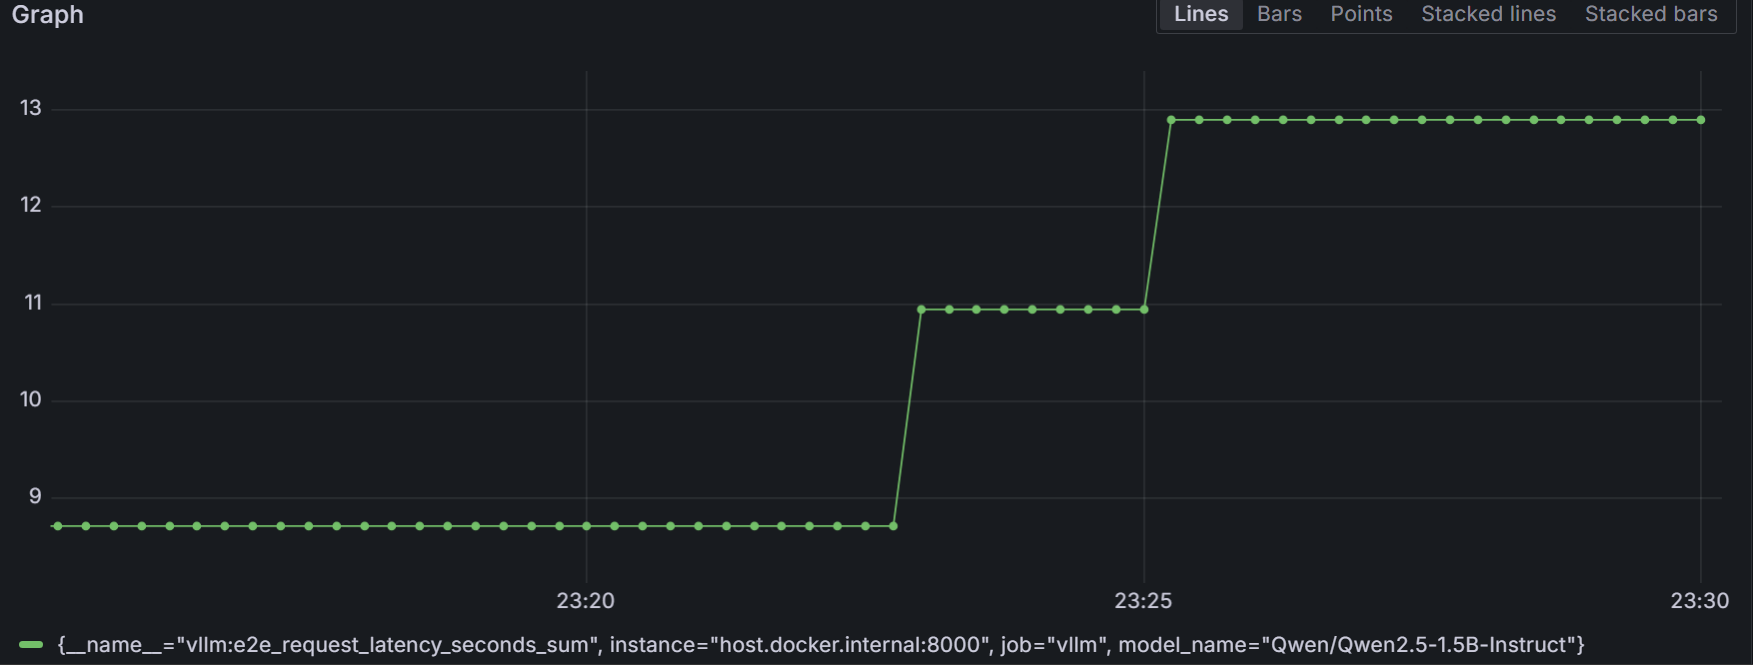
vllm:request_success_total{finished_reason="stop",model_name="Qwen/Qwen2.5-1.5B-Instruct"} 3.07. Grafana dashboards can also be configured to consume the above metrics by navigating to http://localhost:3000. The below picture shows such a dashboard showing vllm:e2e_request_latency_seconds_sum.

Conclusion
The power, flexibility, and scalability offered by vLLM make it an invaluable tool for anyone looking to take their AI projects to the next level without the financial strain of relying on expensive cloud services. vLLM supports several types of hardware accelerators and also has an OpenAI-compatible API server that simplifies deployment and integration. By being fast, efficient, and simple, it opens up new possibilities for using LLMs in all sorts of applications. It makes it easier for anyone to use the power of large AI models.
References
- Welcome to vLLM
- Understanding Inference Time Compute


